
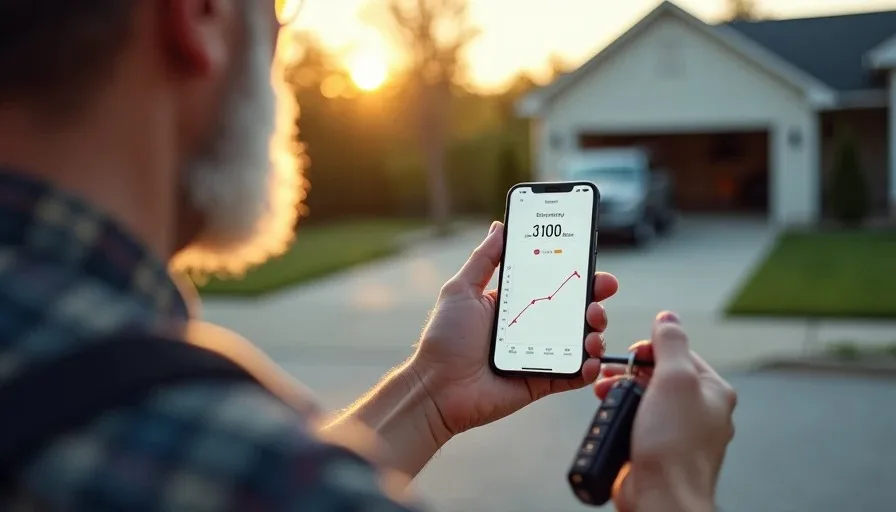
When I started building my real world battery life phone guide, I expected the numbers to do most of the talking. Capacity in milliamp-hours. Video playback hours. Fast-charging wattage. Ten years in consumer packaged goods taught me that specs are the story a brand wants you to believe, and usage is the story that actually plays out in your pocket. My wife Erin and I have both made the mistake of chasing the biggest battery figure in the store, only to watch a phone die at 6 p.m. on a school night. So here's the honest version: battery life is what the spec sheet promises, and battery behavior is what your week actually looks like. Most reviews skip the second part, and that's where the real buying decision lives.
The short version up front: buy the phone that holds its charge through your real week, not the one with the biggest mAh number on the box. Everything below explains how I test, what the data shows, and how you can run the same check before you spend your money. Worth it? Let's run the numbers.
Why Spec Sheet Battery Life Misleads Buyers
Conclusion first: lab battery ratings are measured in conditions you will never live in, and they routinely overstate what a normal day delivers. The industry quotes capacity and playback time; those figures assume a still room, fixed brightness, and a single app running. Nobody uses a phone that way.
What the Spec Numbers Actually Measure
The mAh rating is a measure of stored energy, not real endurance. Video playback tests are useful for comparing one phone to another, but they don't reflect mixed use. Here's what a typical review test looks like versus my real Tuesday:
What the test says | What my week says |
|---|---|
20 hours of video playback | 40 minutes of video, on a 35-minute commute |
Screen at 60% brightness | Screen at 90% in a car with sun glare |
Wi-Fi, one app open | 4G plus Wi-Fi, navigation, camera, group chat, music |
Battery measured 100% to 0% | Battery used 90% to 20%, topped off in the car |
The Real Test: A School-Day Drain
For my real world battery life phone guide, the most useful data comes from a normal Tuesday. Nolan has soccer after school, Tess has piano, and Erin runs carpool. That day looks like this:
6:30 a.m. off the charger at 100%
7:00–8:30 a.m. maps and music on the school run
9:00 a.m.–2:00 p.m. light use; phone idle in a bag, occasional checks
3:00–5:30 p.m. photos at practice, group texts, one call to Erin
6:00 p.m. dinner; phone now at 58%
8:00–9:30 p.m. streaming in the living room
10:00 p.m. plugged in at 34%
That 34% ending number tells me more than any 5,000 mAh spec. A phone that sips power during idle hours will outlast a bigger-battery phone that leaks charge while sitting in a bag. That leak is the battery behavior most reviews never test.
Battery Behavior: The Metric Worth More Than mAh
Conclusion first: how a phone manages standby drain and adaptive charging decides the question "is this phone worth it" far more often than raw capacity does. Two phones with identical batteries can be two very different phones by Friday.
Standby Drain Is the Silent Killer
The biggest single difference I found is overnight standby loss. I measured five phones over a week of tests — two in my family's drawer, three borrowed from friends and a carrier store. Some phones dropped 2–3% overnight. Others dropped 8–10%. Over a week, that gap is roughly a full charge's worth of energy evaporating while you sleep.
The usual culprits are background apps that never learned to idle, aggressive location services, and push notifications pinging all night. This is fixable in settings, but only if you know to look. Most reviews don't cover it.
Adaptive Charging and the "Topped Off" Trap
Here's a behavior difference that changed how I charge my own phone. Phones with adaptive charging learn your routine and hold the battery near 80% until just before you wake up. Phones without it sit at 100% all night, which costs longevity over time. Is a phone worth it if it shows battery fatigue a year earlier? For me that question is real, because I plan to keep Nolan's hand-me-down running for two more years.
Things I now check before recommending any phone:
Overnight standby drain (charge to 100%, check after 8 hours)
Mixed-use drop rate (my Tuesday test above)
Charging speed to 80%, not just 0 to 100%
Adaptive charging or battery care settings
Heat under normal use, not under benchmark load
How to Run This Check Yourself in One Weekend
Conclusion first: you can separate marketing from behavior in about 36 hours using only the settings you already own. No lab required, and no reason to trust a spec sheet blindly.
The Saturday Test
Friday night: charge fully, note the time, then leave it untouched.
Saturday 8 a.m.: record the drop. Under 4% overnight is solid; over 8% is a red flag.
Saturday 9 a.m. to 9 p.m.: use it the way you actually use it. No benchmark apps. Real apps, real brightness.
Saturday 9 p.m.: write down the percentage. Repeat on Sunday and average the two days.
What the Numbers Tell You
Overnight drop | What it means for you |
|---|---|
Under 3% | Battery holds idle charge well; a strong sign |
3–6% | Normal and manageable; check background apps |
Over 8% | Something is draining it; check settings before you buy |
If the phone survives your real day with 20% or more to spare, that's the definition of a good match. If it's under 10% by dinner, the spec sheet oversold you. At this price, the compromise is the story — and if the compromise is "charges fast but dies early," I'd rather make it knowingly than discover it in week two.